
When a pharmaceutical company develops a generic drug, they don’t just slap a new label on an old pill. They have to prove it works the same way as the brand-name version. That’s where bioequivalence (BE) studies come in. These aren’t ordinary clinical trials. They’re highly specialized tests that measure how quickly and how much of the drug gets into your bloodstream. The goal? To show that the test product and the reference product deliver the same amount of medicine, at the same rate. But here’s the catch: if the study is too small, it might miss a real difference. If it’s too big, it wastes time, money, and subjects. That’s why power and sample size aren’t just numbers-they’re make-or-break decisions in drug development.
Why Power and Sample Size Matter in BE Studies
Imagine you’re testing two painkillers. One is the original, the other is a cheaper copy. You give them to 10 people and find that both raise blood levels by about the same amount. Sounds good, right? But what if the real difference is subtle-say, the generic delivers 10% less drug? With only 10 people, you might not see it. That’s a Type II error: you think they’re the same when they’re not. That’s dangerous. Patients could get underdosed or overdosed. On the flip side, if you test 200 people when 30 would’ve been enough, you’ve spent extra money and exposed more people to unnecessary procedures. Power analysis helps you find the sweet spot.
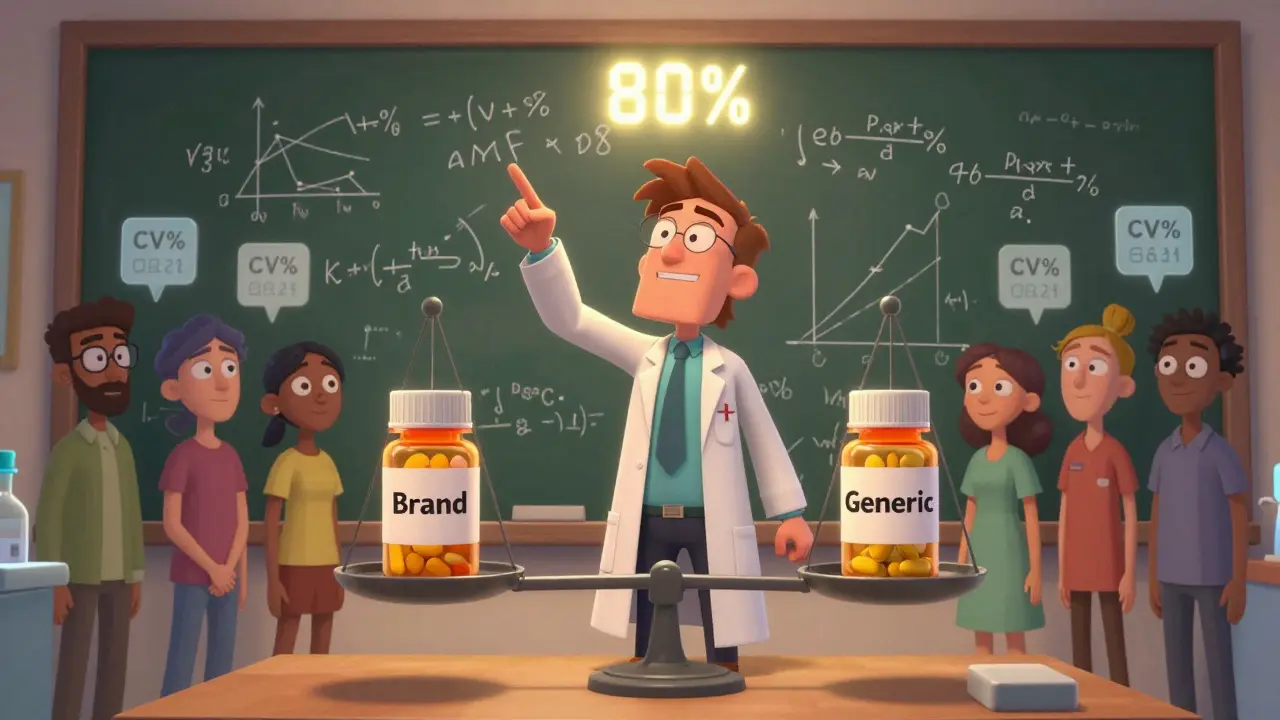
Regulators like the FDA and EMA don’t leave this to guesswork. They require a minimum of 80% power, and often expect 90%. Power here means the chance that your study will correctly say two drugs are bioequivalent if they really are. A power of 80% means you have four out of five chances to detect true equivalence. Set it too low, and you risk failing the study. Set it too high, and you’re overpaying.
What Goes Into the Calculation?
It’s not just about how many people you enroll. Four key factors drive the math:
- Within-subject coefficient of variation (CV%): This measures how much a person’s own drug levels vary from one dose to the next. Some drugs are stable-CVs as low as 10%. Others, like warfarin or valproic acid, swing wildly-CVs over 40%. The higher the CV, the more people you need. A drug with 20% CV might need 26 subjects. One with 35% CV? That jumps to 80+.
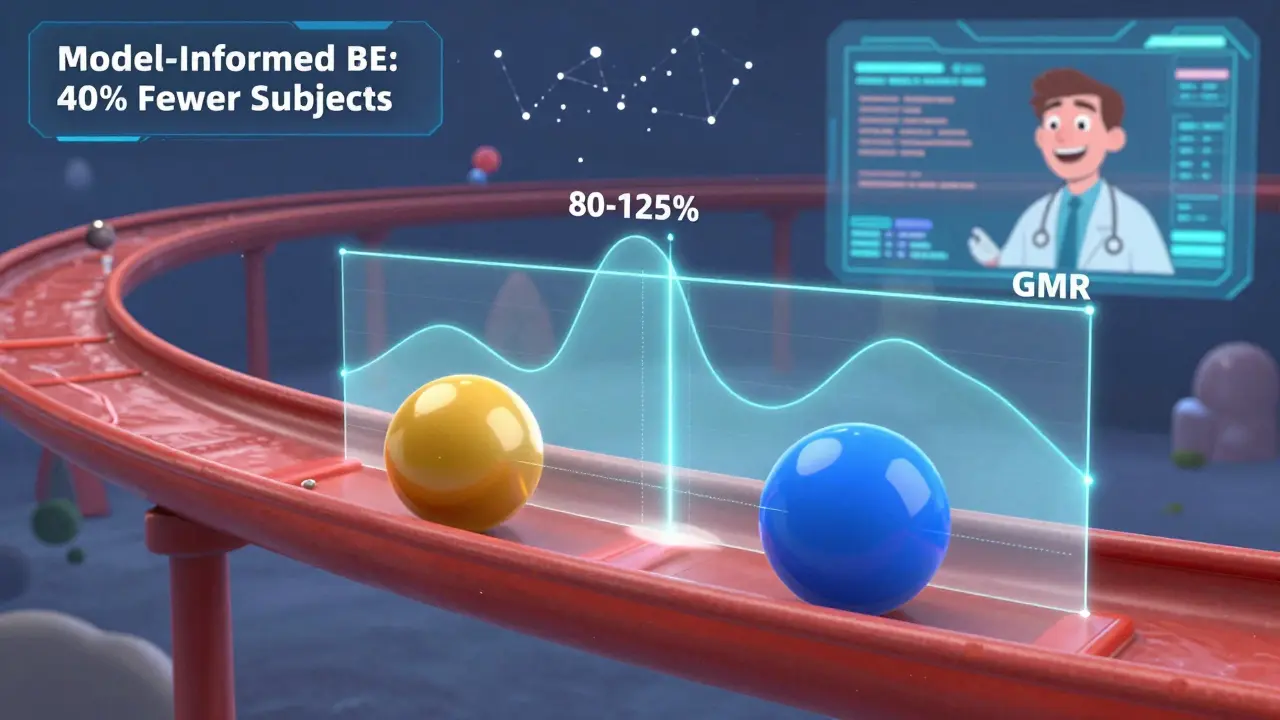
- Geometric mean ratio (GMR): This is the expected ratio of the test drug’s exposure to the reference drug’s. If the test drug delivers exactly the same amount, the GMR is 1.00. But in reality, most generics are designed to be close-usually between 0.90 and 1.10. If you assume 1.00 but the real ratio is 0.95, your sample size estimate can be off by 30% or more.
- Equivalence margins: Regulators accept bioequivalence if the 90% confidence interval of the GMR falls between 80% and 125%. For highly variable drugs (CV > 30%), regulators allow wider margins using RSABE (reference-scaled average bioequivalence). This can cut required sample sizes in half.
- Study design: Most BE studies use a crossover design-each subject gets both drugs in random order. This reduces variability because you’re comparing each person to themselves. Parallel designs (different groups for each drug) need roughly twice as many subjects because you’re comparing different people.
Let’s say you’re testing a new generic antibiotic. Your pilot data shows a CV of 25%, and you expect a GMR of 0.98. With 80% power and 80-125% limits, you’d need about 34 subjects. But if you use a parallel design instead? You’d need 68. That’s a big difference in cost and logistics.
Real-World Numbers: What You Actually Need
There’s no one-size-fits-all number. Here’s what real data shows:
| CV% | Expected GMR | Power | Design | Required Subjects |
|---|---|---|---|---|
| 10% | 0.95 | 80% | Crossover | 18 |
| 20% | 0.95 | 80% | Crossover | 26 |
| 30% | 0.95 | 80% | Crossover | 52 |
| 40% | 0.95 | 80% | Crossover | 88 |
| 45% | 0.95 | 80% | Parallel | 170 |
| 45% | 0.95 | 80% | Crossover + RSABE | 32 |
Notice the last row? That’s where RSABE changes the game. For a drug with 45% CV, a standard crossover study might need 88 people. But with RSABE, you can shrink that to 32. That’s not just cheaper-it’s more ethical. Fewer people enrolled, same confidence.
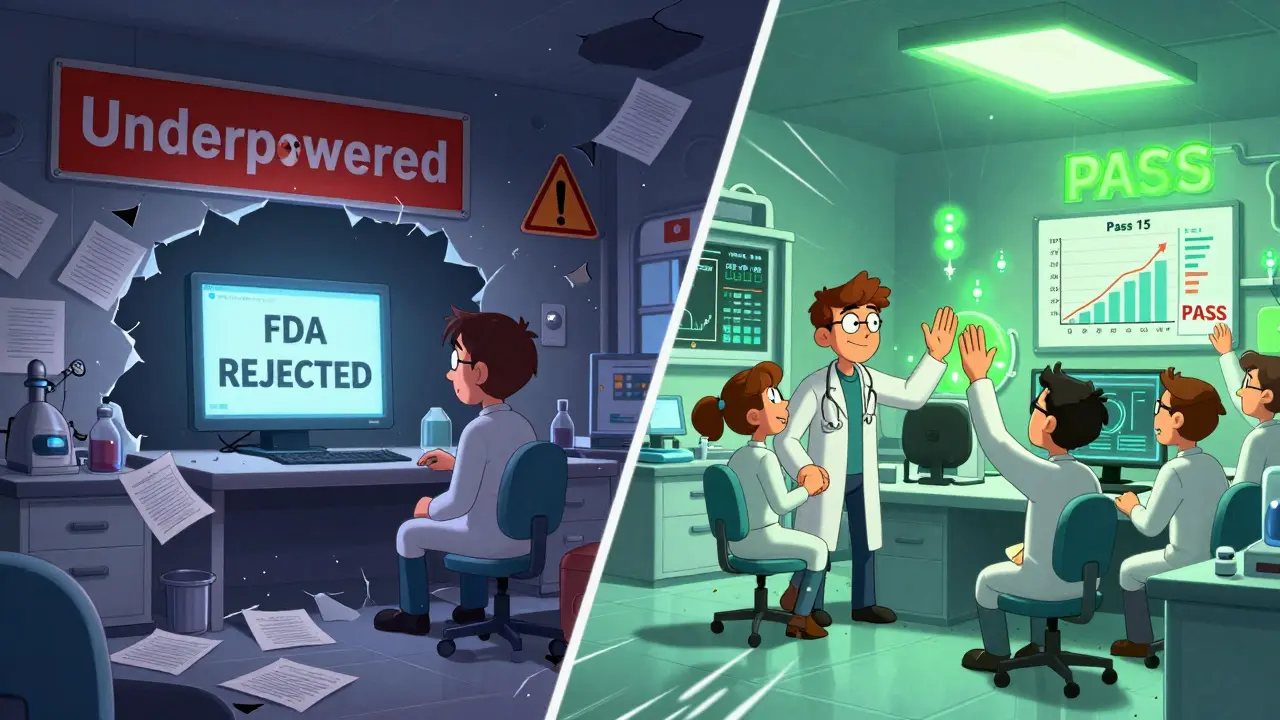
What Happens When You Get It Wrong?
Underpowered studies don’t just fail-they cost millions. In 2021, the FDA cited inadequate sample size in 22% of Complete Response Letters for generic drug applications. That means the application was rejected outright. Companies had to redo the entire study. Some spent over $2 million on a single failed BE trial.
Why does this happen? Three reasons:
- Using literature CVs: Many teams grab CV values from old papers. But the FDA found that literature CVs underestimate true variability by 5-8 percentage points in 63% of cases. If you think a drug’s CV is 20% but it’s really 28%, your sample size is too low.
- Ignoring dropouts: People drop out. They get sick. They move. They change their mind. If you plan for 30 subjects and expect 10% to leave, you enroll 33. Skip this step? You’re down to 27. That’s not enough.
- Only looking at one endpoint: BE studies measure two things: Cmax (peak concentration) and AUC (total exposure). The more variable one drives the sample size. If you only power for AUC and Cmax is way more variable, your study fails on Cmax even if AUC passes.
One company assumed a 15% CV based on literature. Their pilot data showed 28%. They enrolled 24 subjects. The study failed. They had to restart with 56 subjects. Cost: $1.4 million. Time: 18 months.
Tools and Best Practices
You don’t calculate this by hand. You use tools. The most common are:
- Pass 15: Industry standard for regulatory submissions. Handles crossover, parallel, RSABE, and multiple endpoints.
- nQuery: Popular with CROs. Easy interface, good documentation.
- ClinCalc BE Sample Size Calculator: Free, web-based. Great for quick estimates.
- FARTSSIE: Open-source, used by academics and regulators.
Best practices? Three rules:
- Use pilot data, not literature. Even a small pilot (n=12-16) gives you real-world CVs.
- Always calculate for both Cmax and AUC. Use the higher sample size. Don’t assume one is fine.
- Add 10-15% buffer for dropouts. If your calculation says 30, enroll 33-35.
Also, document everything. The FDA’s 2022 review template requires you to list: software name and version, all input values, justification for GMR assumption, and how dropouts were handled. If you skip this, your application gets flagged.
The Future: Adaptive Designs and Model-Informed BE
The field is changing. New FDA guidance allows adaptive designs-where you start with a small group, analyze early results, and then add more subjects if needed. This cuts costs and avoids over-enrollment. But it’s complex. Only a handful of companies use it.
Even more promising? Model-informed bioequivalence. Instead of just measuring blood levels, you use pharmacokinetic models to predict how the drug behaves in the body. This can reduce sample sizes by 30-50% for complex drugs like inhalers or long-acting injectables. But regulators are cautious. As of 2023, less than 5% of BE studies use this approach. It’s the future-but not yet the norm.
Final Takeaway
Power and sample size aren’t afterthoughts. They’re the backbone of a successful BE study. Get them right, and you clear the path to market. Get them wrong, and you waste time, money, and credibility. Use real data. Plan for variability. Account for dropouts. Double-check both endpoints. And never assume your literature CV is accurate. In bioequivalence, the numbers don’t lie. And if they’re wrong, the whole study fails.


Man, I've seen so many BE studies fail just because someone grabbed a CV from a 2010 paper and called it a day. Pilot data isn't optional-it's your lifeline. I once worked on a project where we used literature values, thought we were golden, and ended up redoing the whole thing after 8 months. Cost? Half a million. Lesson learned the hard way.
80% power? That's amateur hour. If you're not shooting for 90%+, you're just gambling with patient safety and regulatory approval.
RSABE? That's not innovation-that's regulatory backdoor manipulation. They're just letting companies cut corners under fancy acronyms. And don't get me started on 'model-informed BE'-it's math magic with no real-world validation.
They're not just underestimating CVs-they're lying. Big Pharma knows how variable these drugs are. They bury the data. They cherry-pick pilots. And then they cry when the FDA rejects them. It's a system rigged to fail. I've seen the spreadsheets. The numbers don't add up. Someone's cooking the books. And we're the ones who pay the price in side effects.
Y'all overthink this way too much. Just get 30 people, give em both pills, see if the numbers look close. If it works for the brand, it works for the copy. Stop wasting money on fancy stats. We ain't launching rockets here.
Dropouts. Always account for dropouts. Always. Not 'maybe,' not 'probably.' Always. One missing data point can collapse your entire confidence interval. It's not a suggestion. It's math.
Hey, if you're new to BE studies, don't panic. This stuff looks scary, but it's just logic with numbers. Start with a pilot, even a tiny one. Use ClinCalc for a quick sanity check. And remember-Cmax and AUC? Treat them like twins. You don't ignore one. Ever. You got this.
In India we do BE studies with 24 subjects and get approval. Why? Because we know the real world doesn't care about your 88-subject crossover. We use local data. We adapt. You think your FDA standards are universal? They're not. We deliver affordable medicine because we don't over-engineer.
It's funny how we treat numbers like they're gods. Power, CV, GMR-they're just tools. The real question is: are we doing this to protect people, or to check boxes? I've seen studies where they enrolled 100 people just because the software said so. But the drug was so stable, 12 would've been fine. We forget: humans aren't data points. We need to ask why we're doing this-not just how.
Let me tell you what really happens. The CRO gets paid per subject enrolled. The sponsor wants to cut costs. The statistician? They're pressured to lower the sample size. And when it fails? Someone gets fired. The system is designed to fail. It's not incompetence. It's incentive. They don't want you to succeed. They want you to spend more. And then they'll sell you the 'revised' version. Again.
pass 15? nquery? Who even uses that stuff? I've done 20 BE studies with excel and a calculator. You don't need fancy software. You need common sense. And if you're using RSABE, you probably just don't know how to run a proper pilot.
Been in this field 15 years. Seen it all. The real secret? Don't overthink. Pilot data. Double-check Cmax. Add 10%. Done. No magic. Just discipline.